TradeDash — Build a repeatable trading process.
For traders who want answers, not more guesswork

See exactly why your
trading isn't consistent.

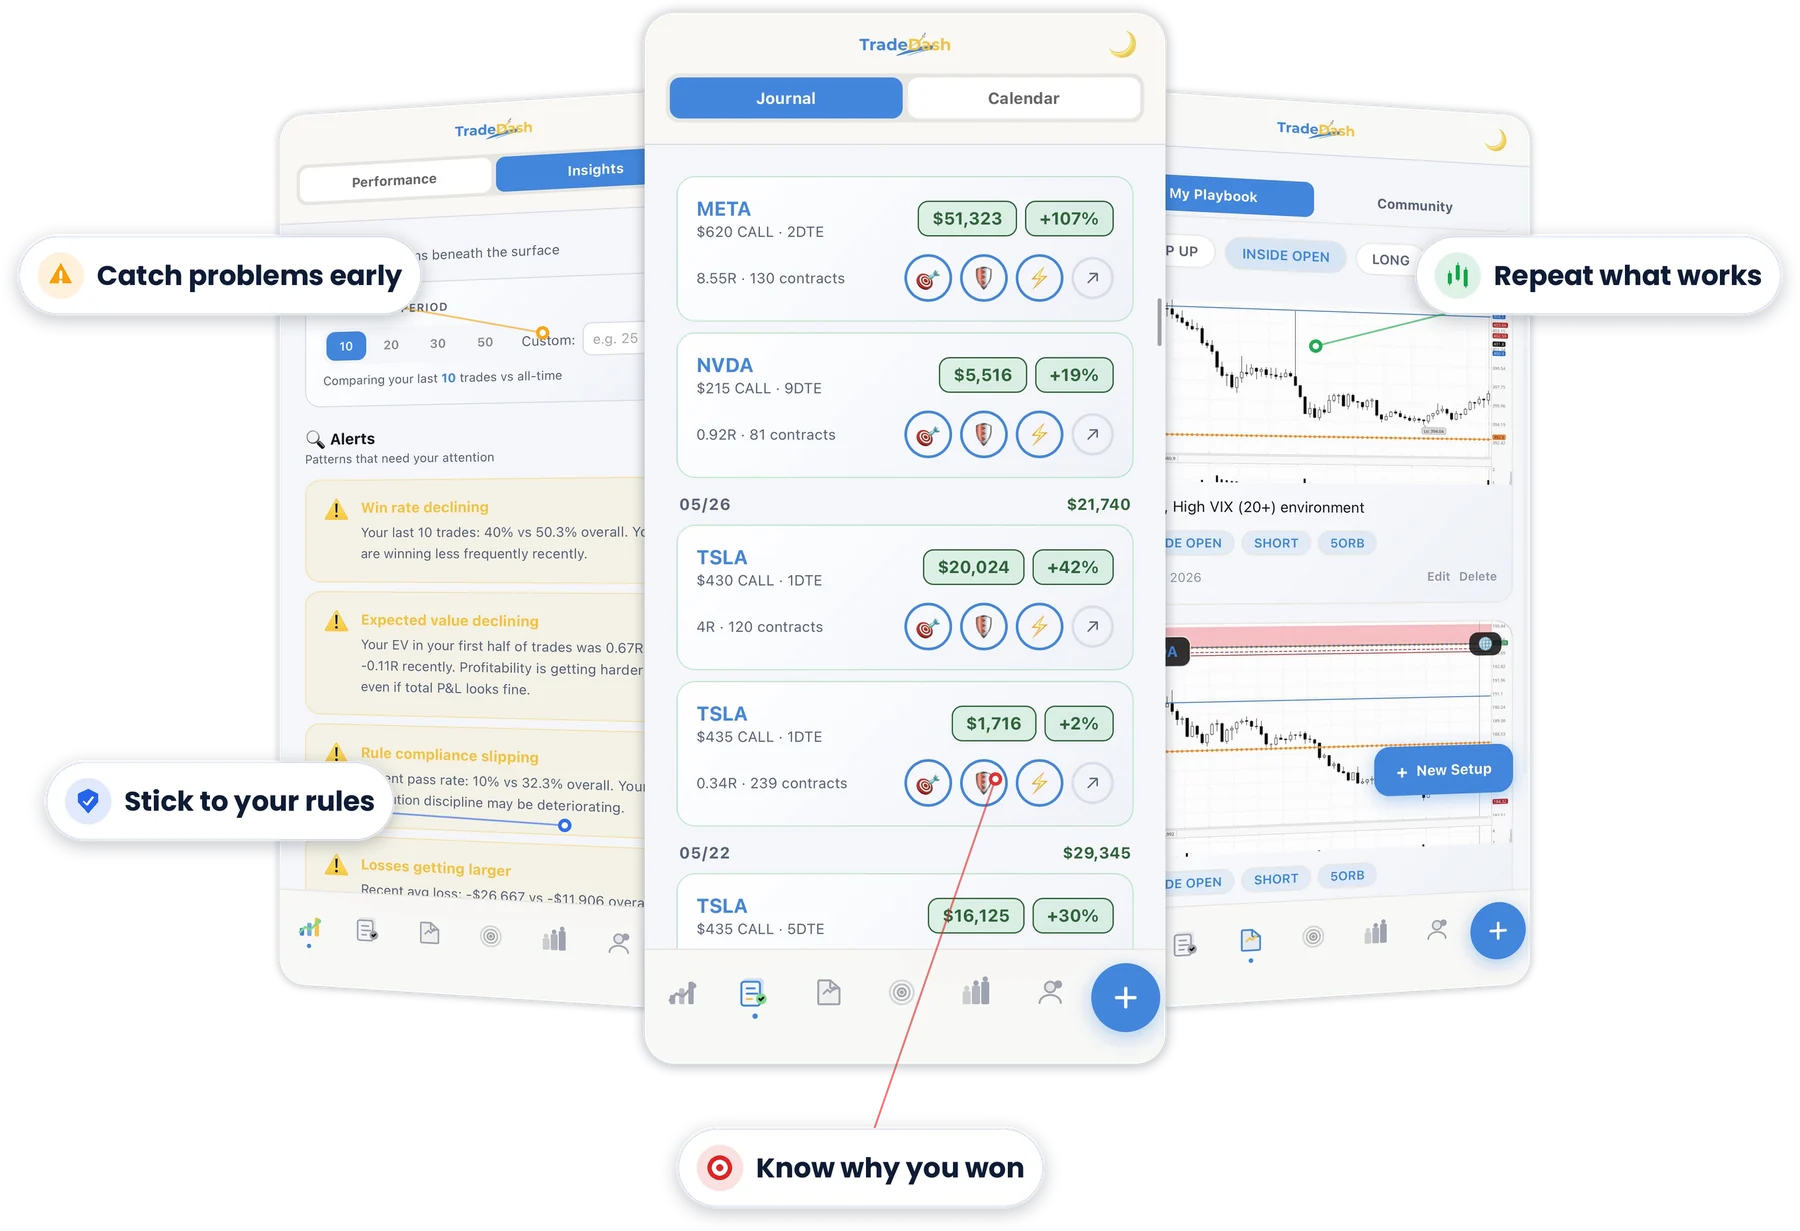
TradeDash grades your entry, risk, and execution on every trade — so you always know which behaviors are building your consistency, and which ones are quietly breaking it.

see how it works
↓   These are the three rules.
What does TradeDash actually measure?

Three behaviors.
Every trade.

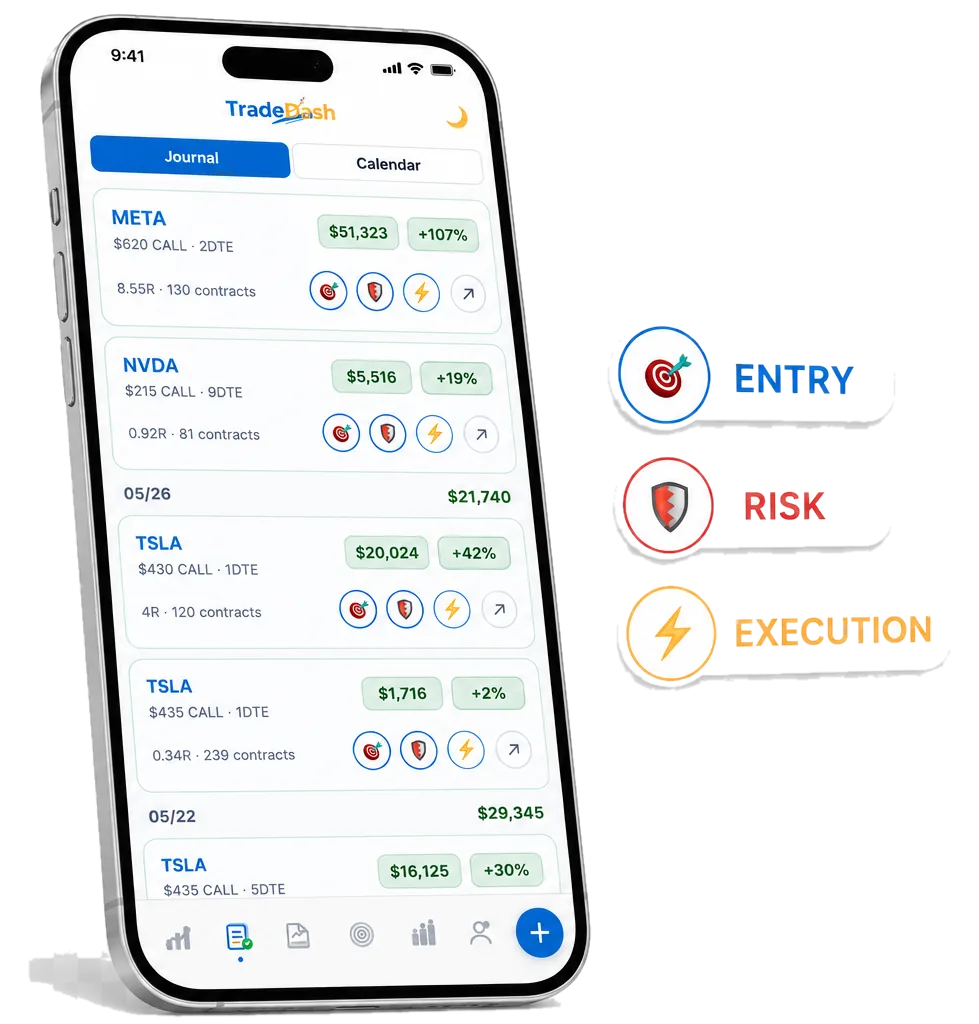
Every trade you take is graded pass or fail on three behaviors. Not outcomes — behaviors. These are the ones that determine whether your process is repeatable.

🎯
Entry
No FOMO chases

Stop known before you're in. Never buy the top. Precise entry, defined risk, every time — not just when you feel confident.

🛡️
TSLA FAILED THIS
Risk
Sized to survive

No single trade can cause financial ruin. The rule that keeps you in the game long enough for the process to compound.

Execution
Exit at your stop

Never average down. Being a good loser, repeated consistently, is what turns a positive-EV process into actual results.

The behavior

Your P&L
can lie to you.

This trade made +$1,247. Sized at 8.3% of the account — the rule allows 5%. It won this time. Repeated across a hundred trades, that behavior breaks the account. TradeDash grades the behavior. Not the outcome.

TSLA
15 contracts · manual exit
+$1,247
+38%
Account Risk
8.3%
Rule Allows
5.0%
🎯 ENTRY
PASS
🛡 RISK
FAIL
⚡ EXEC
PASS
This is real software

Every number, live from
your own trade history.

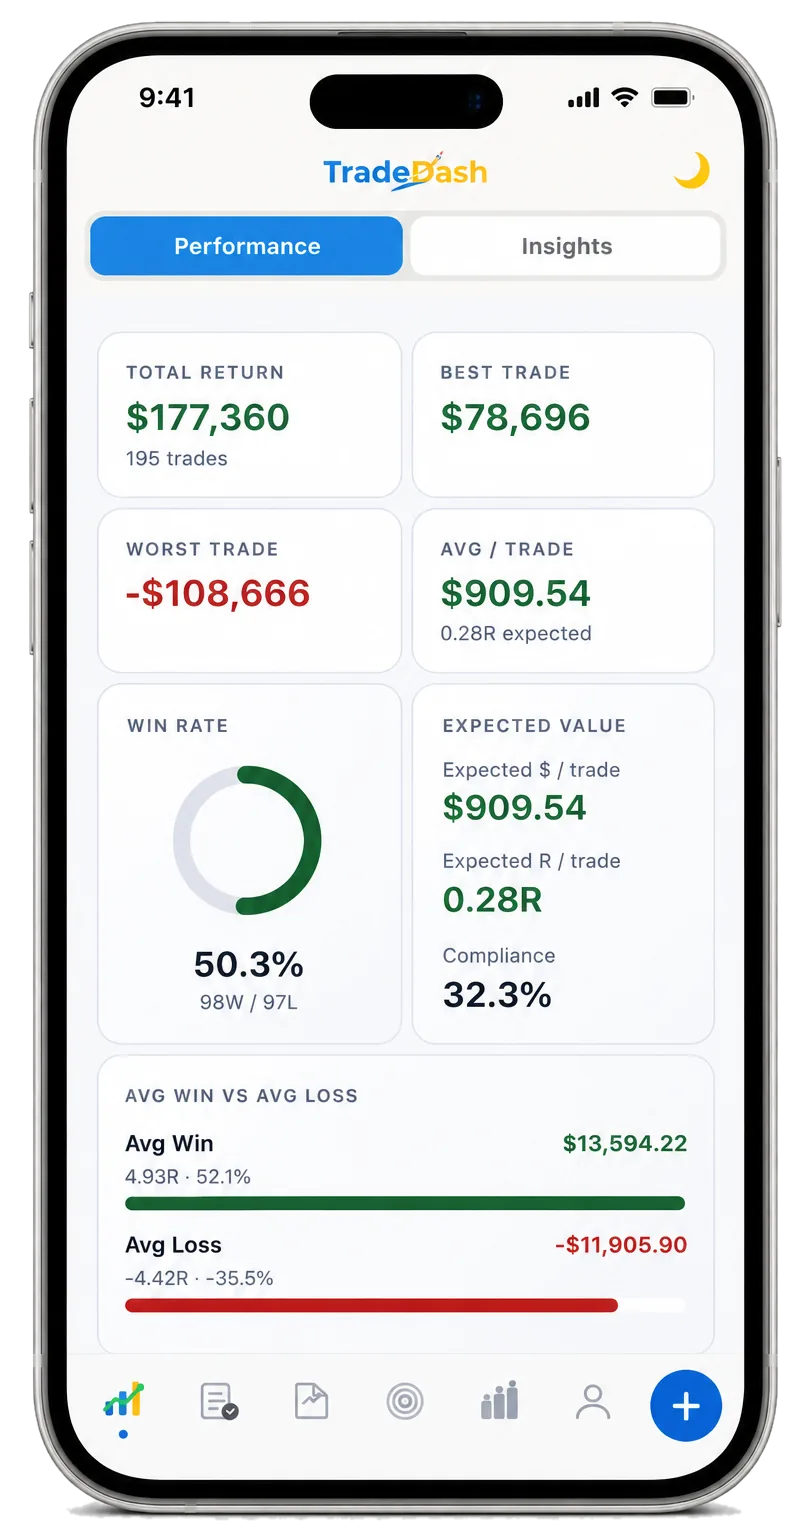
Total Return
$177,360
195 trades
Best Trade
$78,696
Win Rate
50.3%
98W / 97L
Expected Value
Per trade0.28R
Compliance32.3%
↓   One trade means nothing.
06/09
+$86,970
NVDA
$207.5 PUT · 3 DTE
$39,142
+64%
5.59R · 250 contracts
🎯
🛡
TSLA
$402.5 PUT · 3 DTE
$47,828
+65%
6.83R · 150 contracts
🎯
🛡
06/08
-$34,234
GOOG
$355 PUT · 4 DTE
-$3,000
-16%
-0.43R · 50 contracts
🎯
🛡
META
$580 PUT · 2 DTE
-$7,250
-45%
-1.04R · 25 contracts
🎯
🛡
The Journal

Results fluctuate.
Behavior compounds.

One trade means nothing. Log twenty, and a pattern surfaces that no single trade could show you. Every trade auto-imports and gets graded the same three ways — every single one, win or lose.

Why process beats strategy

One trade proves nothing. The process you build in the next 100 trades determines the performance you see in the next 1,000.

Every rule you follow is a vote for the trader you're becoming. Every rule you break is a vote against it.

Built by a trader, not a hedge fund

It started as a Google Sheet. I'd nailed the strategy — technical analysis, setups, all of it — and my results still weren't showing it.

So I built a simple tracker for three things: entry, risk, execution. Pass or fail. Nothing else. My results improved almost immediately. Nothing about my strategy changed. My behavior did. I built the mobile app next, just to make it easier for myself. Then I kept adding to it until it became something worth sharing.

— The Trader Behind TradeDash · Still has a day job
Where most traders focus vs where it actually compounds

You've been focused
on the wrong layer.

5
Results
what most traders obsess over
4
Performance
a lagging indicator of behavior
3
Process
TRADEDASH GRADES THIS
the layer that actually compounds
2
Behavior
what your trades actually reveal
1
Strategy
where everyone starts — and stays stuck

Most traders spend years on Layer 1. TradeDash grades Layer 3 — the one that actually compounds.

↓   It finds the patterns for you.
Insights

It's not just a record.
It's watching for you.

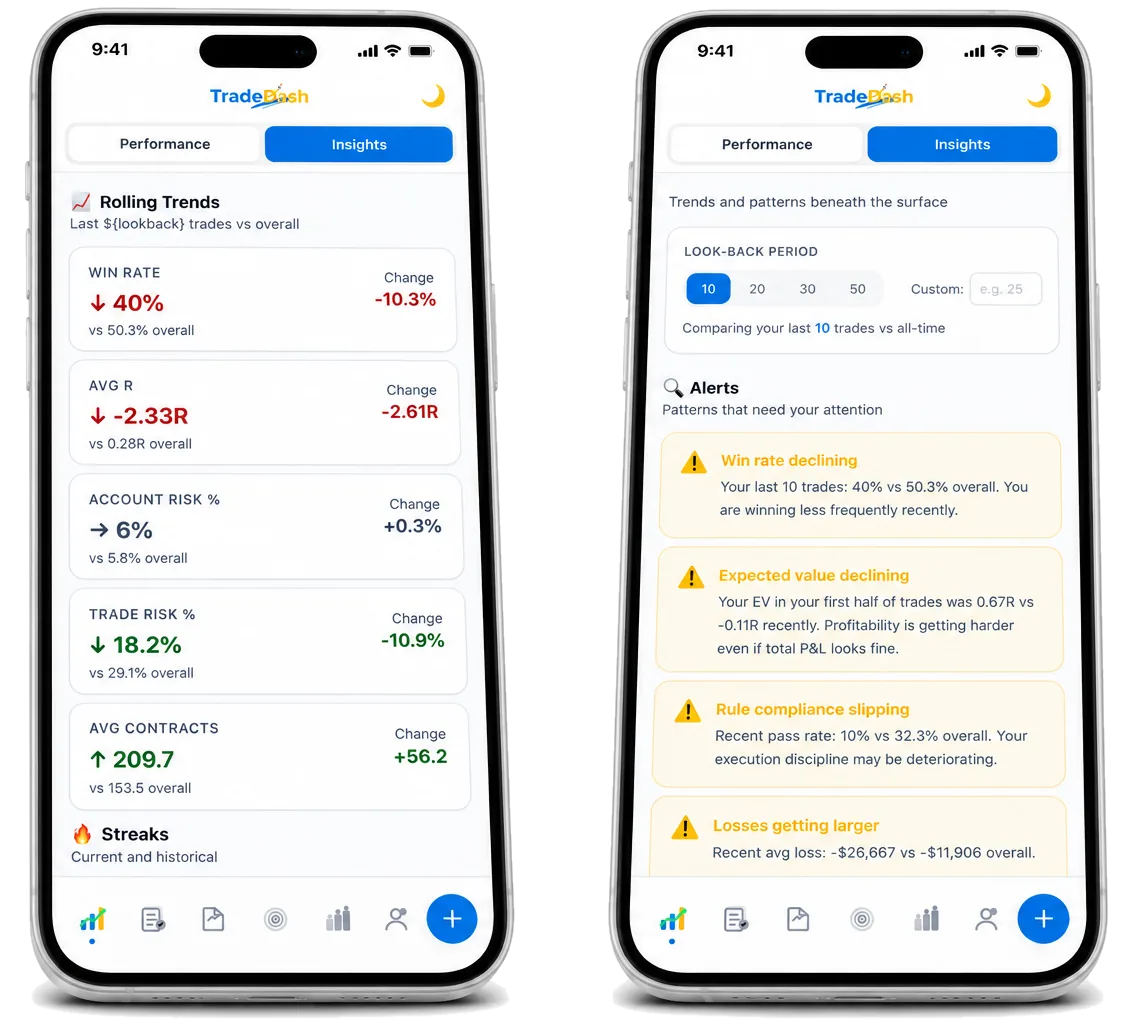
TradeDash compares your last 10 trades against your all-time baseline and flags the moment your behavior starts to drift — before it shows up in your account balance.

📈 Rolling Trends · last 10 trades
Win Rate
↓ 40%
vs 50.3% overall
Avg R
↓ −2.33R
vs 0.28R overall
Trade Risk %
↓ 18.2%
vs 29.1% overall
Avg Contracts
↑ 209.7
vs 153.5 overall
🔍 Alerts
⚠ Win rate declining
Your last 10 trades: 40% vs 50.3% overall. You're winning less frequently recently.
⚠ Rule compliance slipping
Recent pass rate: 10% vs 32.3% overall. Your execution discipline may be deteriorating.
↓   Zoom out.
The Calendar

Improvement isn't
visible day to day.

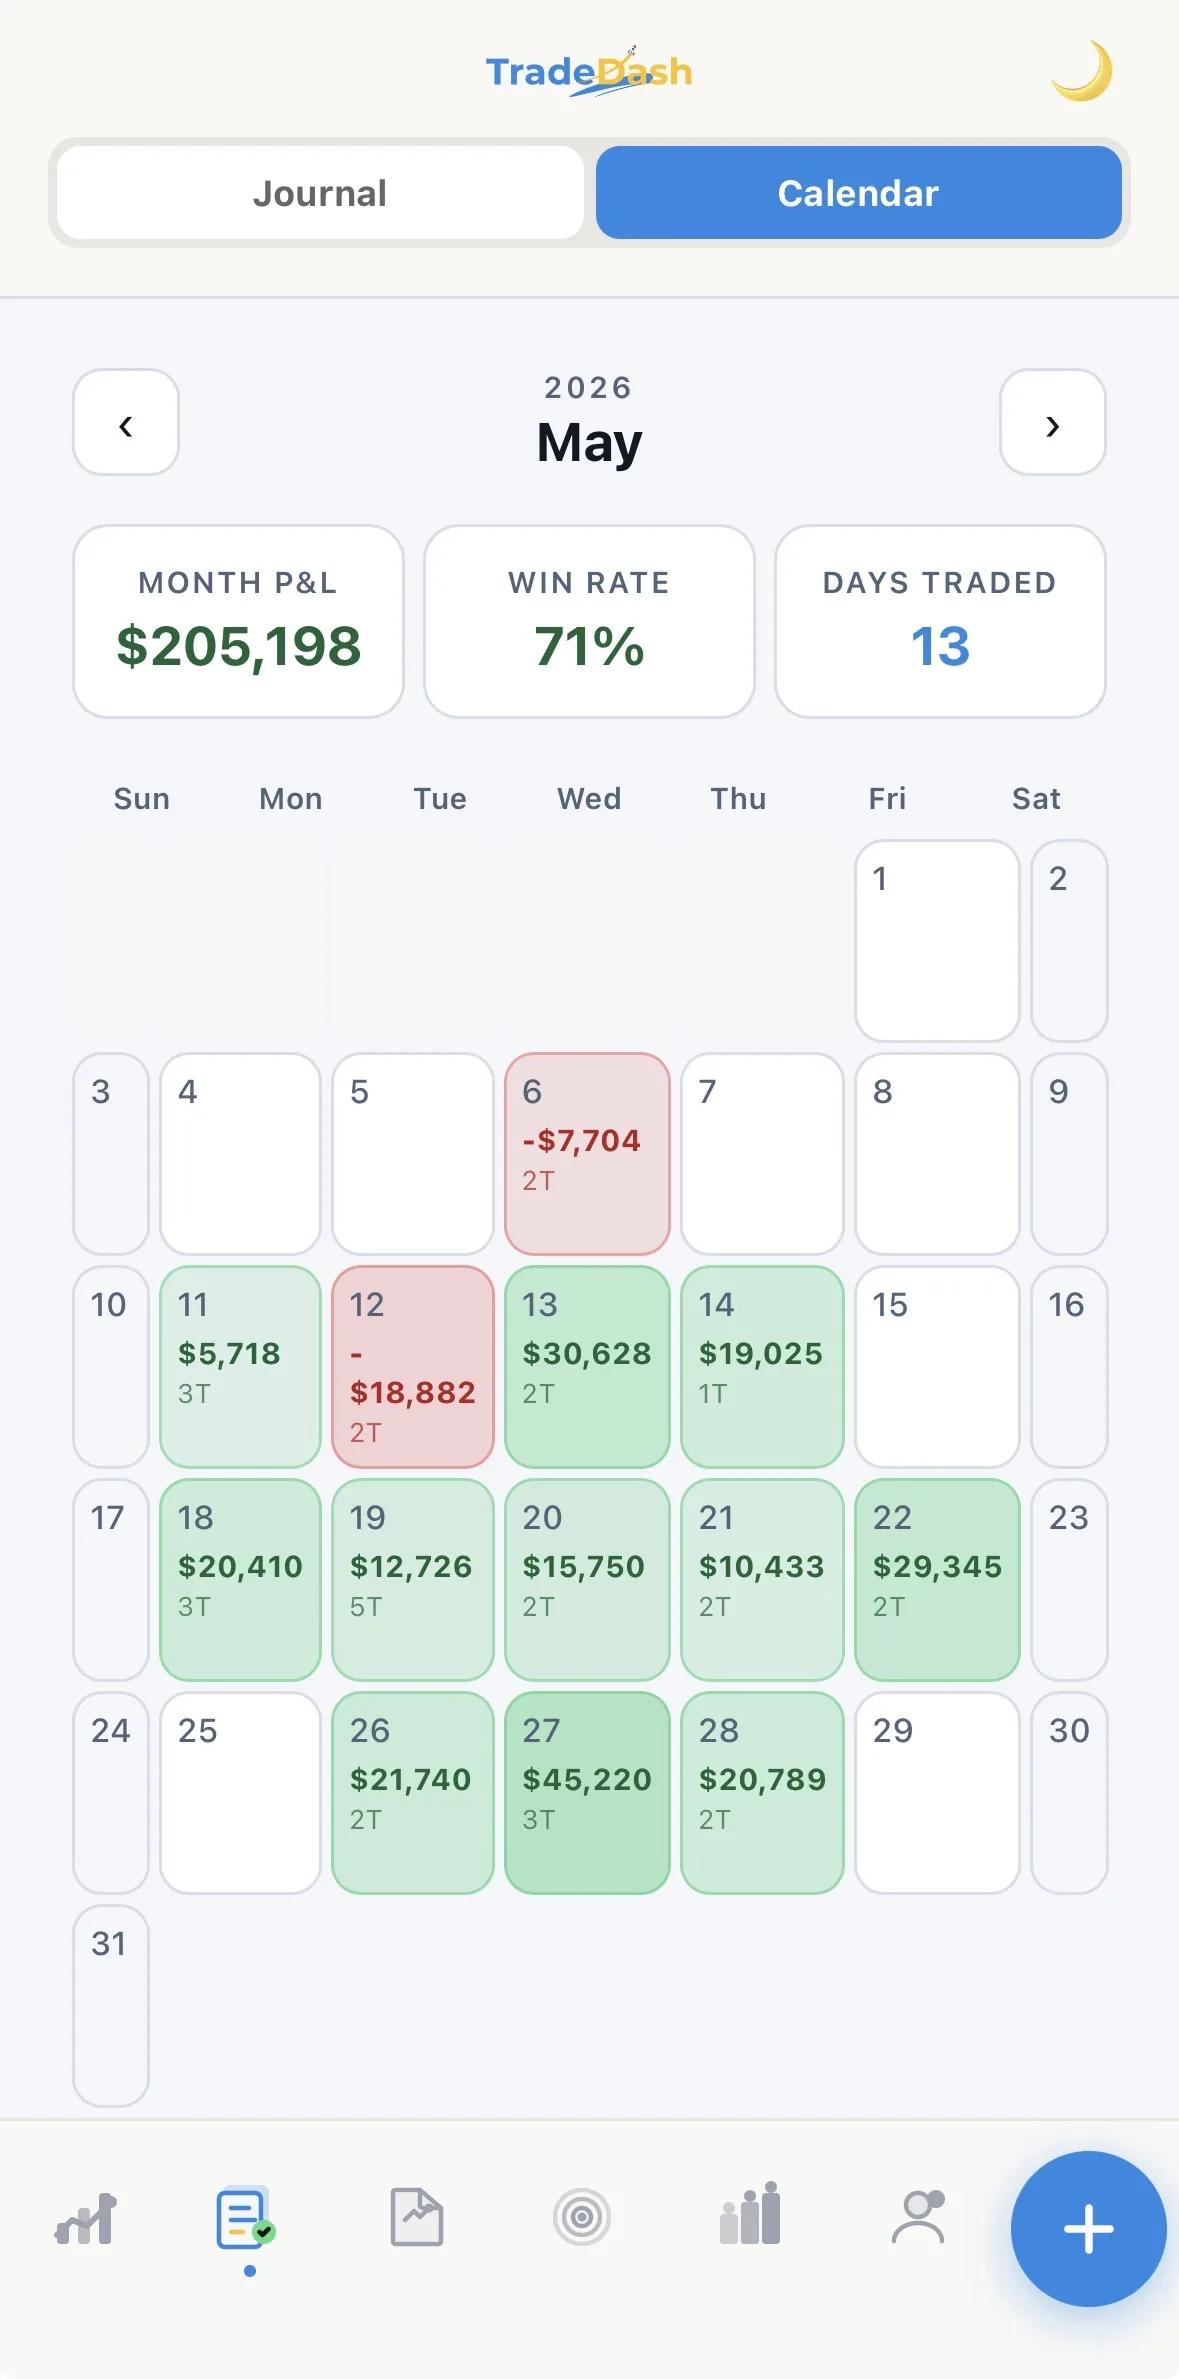
Some days are red. That's trading. Zoom out to a full month and the pattern is impossible to miss — it becomes obvious over time.

May P&L
$205,198
Win Rate
71%
Days Traded
13
S
M
T
W
T
F
S
1
2
3
4
5
6
-$7,704
7
8
9
10
11
$5,718
12
-$18,882
13
$30,628
14
$19,025
15
16
17
18
$20,410
19
$12,726
20
$15,750
21
$10,433
22
$29,345
23
24
25
26
$21,740
27
$45,220
28
$20,789
29
30
31
↓   Here's where the lessons live.
My Playbook
Community
5ORB
CPI
ER
FOMC
GAP DOWN
TSLA
The Playbook

Which setups
actually work
for you?

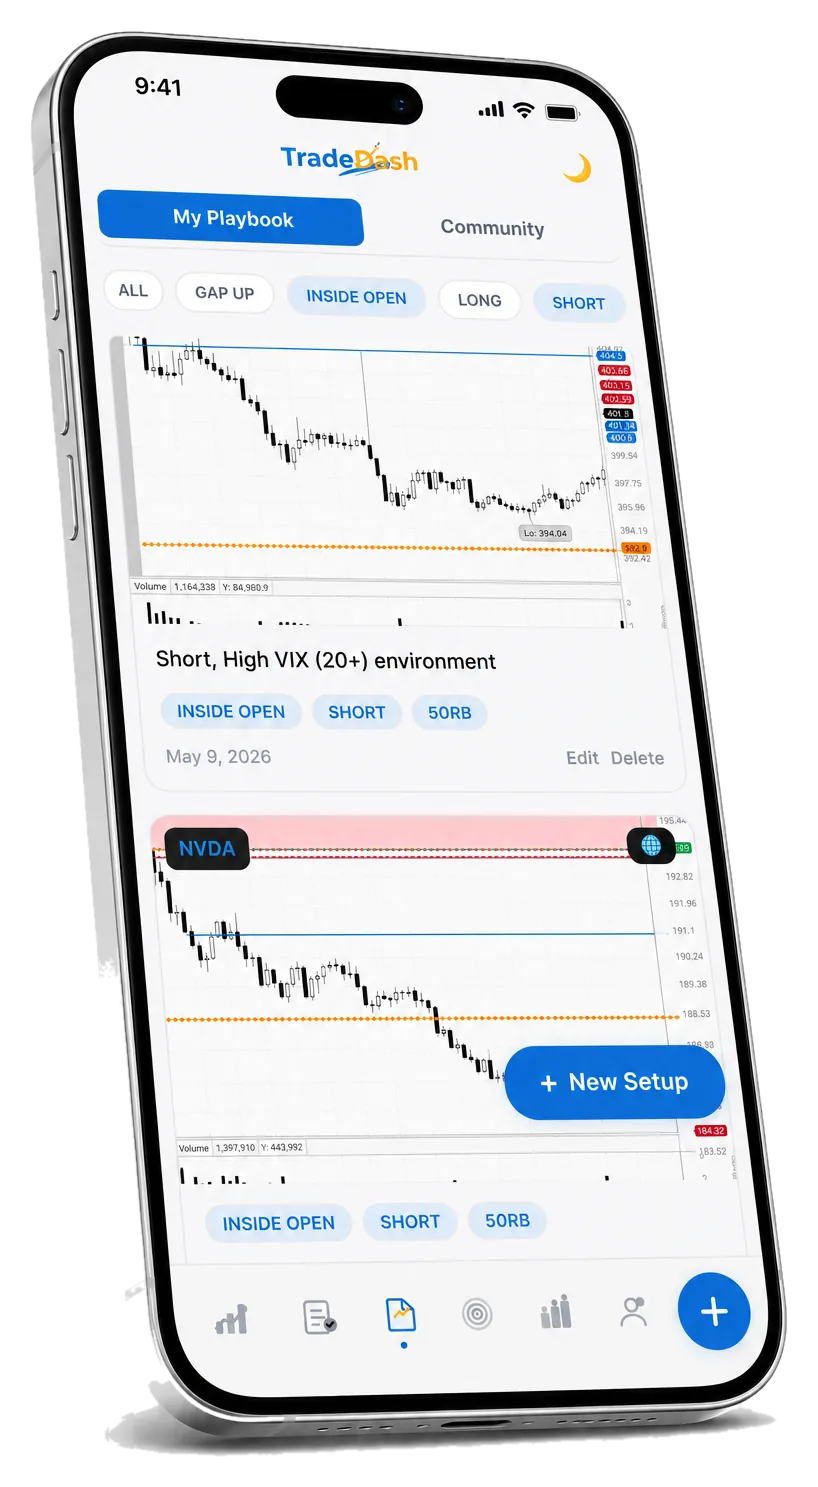
Tag every trade by setup. Filter by outcome. Search by behavior. Over time the Playbook answers the question most traders never can: which specific behaviors — in my trading, not someone else's — actually produce results?

7
consecutive executions of the same process
⚡ Finding Your Rhythm — 5 trade milestone

A streak isn't a score. It's evidence that a process is repeating. The reset is data too — it tells you exactly where the process broke.

The Leaderboard

You can't hide
from your own data.

Compliance rate. Expected value. Dash streak. Every metric on the board is a behavior — not a result.

Private journals are easy to lie to. A public compliance rate isn't. Accountability that's visible changes behavior in ways that private accountability never can.

Live Standings
Week
Month
All Time
🥇
TradeSmart_K
91.2%
comply
+0.82R
EV
🥈
OptionFlow_J
88.9%
comply
+0.71R
EV
4
MAK00830YOU
32.3%
comply
+0.28R
EV

Simple pricing.
Cancel anytime.

Start free. Upgrade whenever you want the full grading engine — Dash streak, Playbook, leaderboard, and more.

Free
Create a free account
No card needed →
OR GO PRO
Monthly
$17
per month
Subscribe →
SAVE 28%
Annual
$147
$12.25/mo · billed yearly
Subscribe →

Secure checkout via Stripe · Cancel anytime from your account settings

Disclaimer: Trading options and other securities involves substantial risk of loss and is not suitable for all investors. Results vary based on individual effort, market conditions, experience level, and application of the tools provided. Becoming a consistently profitable trader takes real time, hard work, and a long learning curve. TradeDash does not guarantee any income, profit, or trading results, and nothing on this page constitutes financial or investment advice. Trade examples and figures shown throughout this page reflect the founder's own real trading activity within TradeDash. They are not representative of typical results, and individual results will vary.